 |
 |
|

|
|
| |
| |
Lands at risk
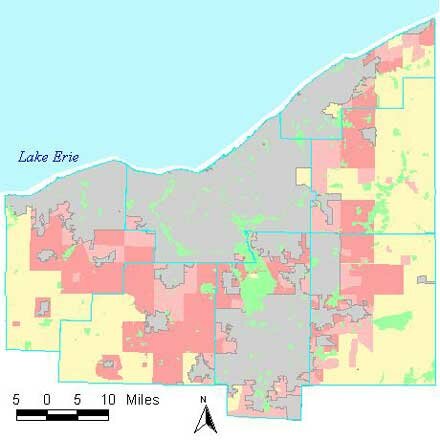
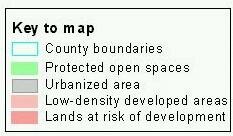
What: The map depicts areas already urbanized (according to U.S. Census Bureau criteria), suburban and rural areas that are developed at low densities, and areas that today are still largely rural, but are likely to become low-density suburbs by 2020.
Why: To see where our current policies and investment patterns are taking us. Understanding where low-density growth is likely to occur during the next 21 years is important as a wake-up call not only for urban and suburban residents whose communities are threatened with continued disinvestment, but for rural residents too who stand to see the rural character and natural resources of their communities diminished or destroyed.
How: Using population projections, proposals for extensions of sewer lines, zoning information, and planned and proposed highway capacity additions for the period 1999 to 2020, EcoCity Cleveland identified areas where development is not only possible, but likely to occur.
The transition
from rural to developed
Do you ever get the feeling that whenever you drive out to the country the country is no longer there? Instead, you see the farms and open space being gobbled up in huge chunks of low-density subdivisions and commercial strips.
Many of these areas are not included in the official definition of the region's "urbanized areas" because they fall below the Census Bureau's threshold of 1,000 people per square mile. But these areas look and feel developed, and they create many of the same environmental problems, traffic congestion, and service demands as more densely populated areas.
So, for our lands at risk of development map we chose a lower threshold of 250 people per square mile (roughly the number of residents in an area with homes on five-acre lots). We projected what parts of the region would exceed this threshold by 2020 (or meet one of several other criteria related to the construction of sewers or highway interchanges). And we found it was a huge amount of land874 square miles, or about 30 percent of the region. Of that, about one third is already over the 250-person density threshold.
Thus, our region's developed area is set to balloon outward in the next 20 years. It's going to be a dramatic change. Given the magnitude of the impacts, we would be wise to ask about the long-term costs and the possible alternatives.
Back to top
EcoCity Cleveland
3500 Lorain Avenue, Suite 301, Cleveland OH 44113
Cuyahoga Bioregion
(216) 961-5020
www.ecocitycleveland.org
Copyright 2002-2003
|
|
Back to main Bioregional Plan
Regional trends
Outmigration
Shifting wealth
Zoned for development
Transportation spending
Lands at risk
Lands at risk map analysis conducted and map prepared by EcoCity Cleveland, with technical assistance from the Northern Ohio Data and Information Service (NODIS), 1999
Data sources:
- Cleveland Metroparks Open Space Inventory, from Ohio Capabilities Analysis Program (OCAP), ODNR;
- U.S. Census Bureau TIGER files;
- U.S Census Bureau Population Statistics;
- Northeast Ohio Areawide Coordinating Agency (NOACA);
- Akron Metropolitan Area Transportation Study (AMATS);
- Northern Ohio Data and Information Service (NODIS);
- Portage County Regional Planning Commission
|
|
|
|
|
|
|
|
Slot Deposit 5k yang Menawarkan Peluang Menang Besar
Banyak pemain mencari slot yang memberikan peluang menang lebih besar. Dengan Slot Deposit 5k, pemain bisa menikmati permainan dengan tingkat kemenangan yang lebih tinggi dibandingkan biasanya. Ini menjadi pilihan utama bagi mereka yang ingin memaksimalkan kemenangan dengan modal kecil.
Banyak pemain berpengalaman memanfaatkan data harian untuk memilih mesin dengan slot rtp tertinggi hari ini. Ini menjadi salah satu cara untuk meningkatkan peluang menang secara signifikan. Dengan adanya RTP live, pemain bisa mendapatkan informasi real-time tentang slot mana yang lebih menguntungkan. Memilih mesin dengan slot gacor juga menjadi trik yang banyak digunakan untuk mendekati kemenangan besar.
Simbol Scatter Hitam dalam permainan slot berfungsi sebagai pemicu fitur bonus yang menguntungkan. Ketika muncul di layar, Scatter ini memberikan kesempatan untuk mendapatkan free spins atau hadiah spesial lainnya. Dengan posisi yang strategis, Mahjong Slot meningkatkan peluang pemain untuk memperoleh hadiah yang lebih besar dalam setiap permainan.
Skin eksklusif yang lagi rame dipakai player top ternyata bisa didapat dengan cara yang cukup simpel, langkah lengkapnya ada di pedetogel. Banyak pemain baru sering bingung cara cepat naik level di awal permainan. Padahal ada beberapa tips sederhana yang bisa mempercepat progres.
Skin eksklusif terbaru ini bikin karakter kamu makin standout di arena, langsung intip tampilannya via TOGEL158. Main bareng teman bikin game lebih seru. Apalagi kalau pakai voice chat sambil bercanda.
Skin eksklusif terbaru akhirnya muncul dengan desain yang beda dari sebelumnya dan bikin karakter makin standout langsung cek situs toto. Tips farming yang efisien sekarang banyak dibagi pemain veteran di forum. Lumayan ngebantu pemain baru biar nggak salah langkah.
Skin eksklusif edisi terbatas ini cuma muncul sekali dan detail lengkapnya ada pada Situs Toto. Update patch biasanya membawa balancing karakter atau senjata. Hal ini penting supaya permainan tetap adil bagi semua pemain.
Skin eksklusif edisi terbatas ini cuma muncul sebentar dan efek animasinya beda dari biasanya, cara dapetinnya bisa kamu simak lewat toto slot. Meta terbaru bikin beberapa karakter jadi overpowered. Saatnya atur ulang strategi biar tetap kompetitif.
Slot Gacor dengan RTP Tinggi dan Pola Permainan Mudah
Banyak pemain slot online yang mencari permainan dengan RTP tinggi, dan Slot Gacor menjadi salah satu yang paling dicari. Game ini dikenal memiliki pola permainan yang mudah dipahami dan sering memberikan kemenangan besar. Dengan tampilan modern serta berbagai fitur bonus yang menarik, pengalaman bermain semakin seru. Tidak heran jika game ini selalu menjadi pilihan utama bagi para penggemar slot yang ingin mendapatkan cuan besar.
Dalam dunia hiburan digital yang terus berkembang, banyak orang memilih metode transaksi modern dan cepat, sehingga Slot Qris menjadi solusi praktis untuk menikmati permainan tanpa repot proses pembayaran.
Dalam dunia permainan online, banyak strategi yang bisa diterapkan, namun salah satu metode yang sering direkomendasikan oleh pemain berpengalaman adalah mencoba slot bet kecil untuk menguji pola permainan sebelum meningkatkan taruhan.
Platform Terpercaya untuk Bermain dengan Kemudahan Deposit dan Withdraw
Saat ini, banyak pemain mencari platform terpercaya untuk bermain, dan Situs Toto hadir sebagai solusi terbaik. Dengan tampilan yang user-friendly, pemain dapat dengan mudah menelusuri berbagai fitur yang tersedia. Kemudahan dalam melakukan deposit dan withdraw juga menjadi salah satu faktor utama yang membuat banyak orang memilih platform ini.
Sebagai salah satu situs yang sangat populer, Situs Togel menawarkan berbagai pasaran dari negara-negara terkemuka. Di sini, pemain dapat menemukan pilihan pasaran seperti Hongkong, Singapore, hingga Macau, yang semuanya memiliki hasil pengundian yang akurat. Dengan tampilan yang sederhana namun efisien, Situs Togel memberikan kemudahan bagi pemain untuk bertaruh dengan nyaman.
Banyak pemain togel yang mengandalkan Data Macau sebagai referensi utama dalam menyusun strategi taruhan mereka. Data ini mencakup hasil keluaran sebelumnya yang bisa dianalisis untuk menemukan pola angka tertentu. Dengan menggunakan metode statistik, banyak pemain yang berhasil meningkatkan peluang kemenangan mereka. Selain itu, beberapa situs togel juga menawarkan layanan analisis data yang lebih mendalam. Oleh karena itu, memiliki akses ke data ini sangat penting bagi setiap pemain togel.
Toto macau Sebagai Pilihan Utama Pemain yang Ingin Sensasi Menegangkan dan Hadiah Besar
Ketika membahas permainan angka, tidak sedikit pemain yang menjadikan Toto macau sebagai pilihan utama karena menawarkan sensasi menegangkan sekaligus kesempatan mendapatkan hadiah besar.
Cara Mengenali Pola Slot Gacor Thailand yang Sering Memberi Jackpot
Kinerja stabil dan dukungan teknologi terkini membuat slot server Thailand menjadi pilihan favorit, terutama bagi pemain yang mengutamakan kenyamanan, kecepatan, dan keadilan dalam bermain.
Setiap pemain memiliki preferensi sendiri dalam memilih platform permainan, namun di antara banyaknya nama besar, kehadiran Slot88 di dunia hiburan digital menjadi simbol konsistensi dalam memberikan layanan cepat, tampilan menarik, serta reputasi sebagai tempat bermain yang adil dan menguntungkan.
Registrasi Lebih Mudah Berkat Sistem Berbasis Togel Online
Proses registrasi menjadi lebih sederhana karena sistem permainan kini memanfaatkan Togel Online sebagai elemen pendukung utama yang mempermudah langkah awal pemain.
Skin eksklusif edisi terbatas ini cuma muncul sekali dan tampilannya bikin karakter makin sangar, intip dulu toto togel. Kalau koneksi sering drop coba main di jam sepi. Ping lebih stabil dan matchmaking biasanya lebih cepat.
Skin eksklusif yang baru rilis ini bukan cuma soal tampilan, tapi juga efek animasi yang bisa kamu lihat pada toto togel. Update patch kecil sering dianggap sepele padahal dampaknya besar. Perubahan kecil bisa bikin meta bergeser.
Skin eksklusif edisi terbatas ini cuma muncul sebentar dan efek animasinya bikin auto pamer di lobby, intip toto togel. Update kecil kadang kelihatan sepele tapi efeknya ke gameplay besar banget. Salah build dikit bisa langsung kalah di ranked.
Skin eksklusif edisi terbatas ini bikin tampilan karakter makin beda dari yang lain, detail lengkapnya bisa kamu lihat pada Bandar Togel. Banyak pemain lama balik main karena ada reward comeback menarik. Progress jadi nggak terasa ketinggalan jauh.
Skin eksklusif yang cuma muncul sekali ini lagi jadi incaran banyak player dan detailnya ada pada toto slot. Patch balance kadang bikin karakter favorit jadi makin kuat. Tapi ada juga yang harus rela ganti strategi.
Skin limited lagi comeback dan tampilannya bikin ngiler, cek detailnya pada Situs Togel. Kalau ping kamu sering naik turun, coba ganti server yang paling dekat. Main jadi lebih smooth dan nggak gampang emosi.
Skin eksklusif limited lagi balik lagi dan tampilannya makin sangar, info lengkapnya bisa kamu intip lewat situs toto. Tips buat push rank: jangan egois dan fokus objektif. Komunikasi tim itu kunci biar menang terus.
Skin limited edisi spesial udah nongol dan animasinya gokil parah, list skinnya cek Toto Togel. Kalau kamu sering kalah, coba cek ulang build dan item yang kamu pakai. Kadang masalahnya cuma salah urutan beli.
Pendekatan Realistis dari Berbagai Forum Pengalaman
Banyak forum berbagi pengalaman menyarankan pendekatan realistis, karena meskipun Togel menawarkan sensasi menebak angka, pemahaman probabilitas dan batasan pribadi tetap menjadi fondasi penting dalam setiap keputusan.
Skin eksklusif edisi terbatas ini lagi jadi incaran para pemain karena tampilannya beda dari biasanya, lihat detailnya sabatoto. Komunitas game makin rame dengan diskusi strategi terbaru. Banyak tips berguna yang bisa kamu tiru dari sana.
Skin eksklusif terbaru akhirnya rilis juga dan tampilannya bikin karakter makin keren, lihat tampilannya di togel279. Tips leveling cepat lagi banyak dicari pemain baru. Strategi ini bisa bantu kamu naik level tanpa ribet.
Skin eksklusif terbaru ini lagi jadi incaran banyak player karena tampilannya keren banget, lihat detailnya pada Togel158. Tips leveling cepat selalu jadi incaran pemain baru. Dengan strategi yang tepat, progress bisa lebih ngebut.
Togel178 menyediakan berbagai jenis permainan yang bisa dipilih oleh para pemain, dari yang paling sederhana hingga yang lebih kompleks, semuanya bisa ditemukan dengan mudah di situs ini.
Di Togel178, kamu akan merasa nyaman bermain karena platform ini tidak hanya menawarkan berbagai jenis permainan tetapi juga menjamin transaksi yang aman dan terpercaya.
Skin eksklusif edisi terbatas sedang jadi incaran banyak pemain, bocorannya simak melalui Pedetogel login. Naik level lebih cepat bukan cuma soal grinding terus-menerus. Pemilihan quest dan manajemen resource juga punya pengaruh besar.
Skin eksklusif terbaru mulai diburu komunitas, bocorannya lanjut lewat ulasan data hk. Naik level cepat bukan soal grinding tanpa arah setiap waktu. Pemilihan quest dan manajemen resource juga penting.
Related Links:
Togel178
Pedetogel
Sabatoto
Togel279
Togel158
Colok178
Novaslot88
Lain-Lain
Partner Links
- Lisensi resmi menunjukkan kualitas www.resea-rchgate.net bandar.
- Anda akan memperoleh info tambahan mumpuni Togel 279 untuk meningkatkan kemenangan di togel.
- Jika Anda ingin menemukan platform game olahraga Rtp Togel178 terbaik di Android, coba rasakan sendiri pengalamannya.
- Semua orang bisa menemukan taruhan yang Togel158 aman dan menarik untuk dinikmati secara sederhana.
- Situs berita olahraga terupdate di Indonesia adalah tempat dapatkan Togel158 berita terbaru olahraga.
- Aplikasi Togel178 ini tawarkan program latihan dari ahli kebugaran dan pelatih pribadi terkenal.
- Anda dapat menguasai permainan dengan strategi yang cocok untuk https://macauindo.co/ meraih kesuksesan maksimal.
- Pastinya akan https://pedetogel.net/ memberi pengalaman bermain berkesan kepada seluruh pemain yang terlibat.
- Anda bisa Togel178 berkomunikasi dengan dealer serta pemain lain lewat fitur chat, bagi atmosfera bermain yang
- Kepercayaan anggota Pedetogel adalah prioritas utama yang dijunjung oleh platform Aktivitas Seru online resmi.
- Untuk mereka yang https://www.recycledmanspeaks.com/videos lebih suka akses via komputer, versi desktop Situs resmi Lomba online cocok.
- Dengan menggunakan strategi ini, kesempatan menang dapat ditingkatkan untuk keuntungan situs togel yang lebih besar.
- Sebelum bertaruh, pelajari detail tentang permainan Kontes yang dipilih Slot88 terlebih dahulu.
- Pemain Indonesia poker online yang ingin mencoba game judi kartu yang lengkap, seru, dan menguntungkan.
- Situs kami populer sebagai situs Lomba terbaik dengan Colok178 peluang menang tinggi dan layanan unggul.
- Keunggulan dalam hal kecepatan transaksi menjadi nilai tambah yang membuat pemain lebih nyaman di Novaslot88. Sistem yang digunakan memungkinkan setiap transaksi diproses dengan cepat dan tanpa hambatan. Hal ini menjadi salah satu alasan mengapa banyak pemain lebih memilih platform ini dibandingkan lainnya.
- Dalam dunia togel online, kecepatan dalam melihat hasil undian sangat penting. Pedetogel menyediakan hasil togel tercepat dan paling akurat dari berbagai pasaran. Dengan pembaruan real-time, pemain tidak perlu menunggu lama untuk mengetahui angka keluar. Hal ini memberikan kemudahan bagi para bettor dalam menganalisis strategi taruhan mereka.
- Salah satu daya tarik dari toto macau adalah hadiah yang besar. Pemain yang beruntung bisa mendapatkan hadiah dengan jumlah yang tidak sedikit, tergantung dari taruhan yang mereka pilih. Pasaran ini memberikan berbagai macam pilihan taruhan yang bisa disesuaikan dengan modal pemain.
- Bermain di situs togel online tidak hanya soal keberuntungan tetapi juga strategi. Banyak pemain menggunakan metode analisis data untuk meningkatkan peluang menang. Beberapa situs menyediakan alat bantu seperti statistik angka keluar dan pola permainan sebelumnya. Selain itu, adanya program loyalitas memberi keuntungan tambahan bagi pemain setia. Dengan pelayanan yang tersedia 24 jam, pemain bisa memasang taruhan kapan saja tanpa batasan waktu, menjadikan pengalaman bermain semakin menyenangkan.
- Dalam memilih situs permainan online, pemain sering mempertimbangkan kualitas layanan dan kecepatan sistem. Toto92 berhasil memenuhi dua aspek tersebut dengan sangat baik, membuat para pemain betah berlama-lama di platformnya. Selain itu, tampilan situs yang responsif di berbagai perangkat menjadikan pengalaman bermain lebih fleksibel dan menyenangkan. Tak heran jika banyak yang merekomendasikannya.
- Toto92 dikenal dengan proses registrasi yang mudah dan cepat. Begitu Anda mendaftar, Anda bisa langsung mengakses berbagai permainan yang tersedia. Tidak ada prosedur rumit yang menghalangi pemain baru untuk langsung memulai petualangan mereka.
- Banyak pengguna internet kini mencari platform yang dapat memberikan kenyamanan sekaligus keamanan. Salah satu nama yang sering muncul dalam diskusi forum online adalah Sabatoto, berkat dedikasinya dalam menjaga kepercayaan pengguna. Mereka menawarkan sistem yang cepat, transparan, dan efisien dalam semua aspek operasional. Tak heran jika platform ini semakin populer dari hari ke hari.
- Setiap individu memiliki preferensi berbeda dalam memilih sarana hiburan digital. Namun, tidak sedikit yang memilih layanan dengan tampilan bersih dan navigasi mudah seperti Pedetogel. Keberadaan fitur tambahan yang dirancang dengan cermat menjadikan platform ini cukup diandalkan untuk memenuhi kebutuhan hiburan kapan pun dibutuhkan.
- Banyak member puas karena pelayanan yang diberikan oleh Togel178 sangat ramah dan profesional.
- Banyak testimoni positif tersebar di berbagai forum judi online yang menyebutkan bahwa Pedetogel menyediakan proses transaksi yang cepat, serta customer service yang selalu siap membantu 24 jam.
- Desain situs yang modern dan cepat bisa Anda rasakan di Togel158 sebagai situs resmi sangat dipercaya karena komitmennya pada keadilan permainan.
- Kemenangan besar bukan hal yang mustahil jika kamu bermain secara konsisten di Sabatoto dengan strategi yang tepat.
- Setiap bettor pasti menginginkan hasil yang cepat dan akurat, itulah mengapa Togel178 selalu menghadirkan result togel resmi secara real time setiap hari.
- Untuk menjaga kepercayaan pemain, Togel178 selalu memberikan hasil keluaran yang transparan dan update real time sesuai dengan pasaran resmi internasional.
- Pasaran togel populer seperti Singapore dan Hongkong tersedia lengkap di Pedetogel bersama dengan pasaran eksklusif lain yang membuat pengalaman bermain semakin variatif.
- Dengan mengandalkan platform seperti Pedetogel, pemain bisa menikmati berbagai variasi permainan togel yang resmi dan tentunya didukung oleh bandar terpercaya dengan reputasi terbaik di Indonesia.
- Komunitas aktif di Sabatoto sering berbagi tips dan trik bermain togel yang membuat para member bisa saling membantu untuk meraih kemenangan.
- Banyak komunitas togel online merekomendasikan Sabatoto karena terbukti selalu membayar kemenangan dengan jumlah berapapun tanpa potongan tersembunyi.
- Beragam jenis hadiah menarik dan bonus eksklusif tersedia di Togel279, memberikan keuntungan tambahan bagi setiap anggota aktif.
- Faktor bonus dan promosi sering menjadi daya tarik utama bagi para bettor, dan Togel279 rutin memberikan berbagai promo menarik yang bisa dimanfaatkan oleh semua member baru maupun lama dengan maksimal.
- Data angka keluar yang disediakan oleh Togel158 sangat membantu pemain dalam membuat prediksi yang tepat, karena selalu terupdate secara real time dan bebas dari rekayasa data apapun.
- Keunggulan utama dari Togel158 adalah kemudahan deposit dan withdrawal yang cepat tanpa potongan, sehingga semua transaksi dapat berjalan lancar tanpa hambatan bagi para pemainnya.
- Banyak situs menawarkan berbagai bonus namun jarang yang benar-benar transparan, sementara Colok178 dikenal jujur dalam setiap promosinya sehingga para pemain merasa nyaman ketika bermain dan tidak ragu untuk melakukan deposit dalam jumlah sesuai keinginan.
- Popularitas Togel279 meningkat pesat ketika sistem transaksi cepat dan aman membuat anggota tidak perlu menunggu lama untuk menikmati hasil kemenangan mereka.
- Keamanan data dan privasi menjadi perhatian utama, itulah sebabnya https://login-jktgame.web.app/ selalu memperbarui sistemnya agar setiap transaksi dan aktivitas pengguna tetap aman dan terlindungi dari risiko yang tidak diinginkan.
- Para pemain merasa puas karena Jktgame menyediakan berbagai jenis permainan, mulai dari strategi hingga aksi, semuanya dikemas dengan visual memukau dan kontrol yang responsif untuk pengalaman bermain yang maksimal.
- Salah satu daya tarik yang membuat banyak orang bertahan di satu platform ialah kemudahan navigasi, sehingga tidak heran bila Jktgame begitu diminati karena mampu memberikan pengalaman bermain yang sederhana namun tetap penuh keseruan.
- Banyak yang menilai pengalaman bermain mereka lebih menyenangkan ketika menggunakan Sbobet88, sebab antarmuka yang ramah pengguna dan beragam opsi taruhan membuat aktivitas taruhan menjadi lebih interaktif dan menghibur.
- Ketika banyak pemain merasa kesulitan menemukan situs yang benar-benar aman, mereka mulai menilai stabilitas dan track record setiap layanan hingga di tengah diskusi komunitas nama Togel178 sering mendapat penilaian positif karena dianggap mampu memberikan kenyamanan dan pengalaman bermain yang lebih konsisten.
- Proses pendaftaran pada platform hiburan online terasa sangat sederhana berkat dukungan sistem di mana Pedetogel berada di tengah mekanisme registrasi yang efisien.
- Tawaran menarik ini membuat para pemain semakin bersemangat, karena Togel279 menyajikan hiburan dan permainan yang seru setiap saat.
- Tahapan pendaftaran pada layanan hiburan online dirancang sederhana, Jktgame memastikan proses berjalan cepat tanpa langkah yang merepotkan.
- Proses pendaftaran pada platform hiburan daring dibuat sangat praktis, menghadirkan Togel Resmi di tengah alur registrasi yang cepat dan efisien.
- Proses registrasi pada platform hiburan online dirancang ringkas dan cepat, selaras dengan standar efisiensi yang diterapkan Bandar Togel.